Reimagined Krebs Cycle of Creativity for design professionals
Mapping Your Creative Metabolism: The Krebs Cycle of Creativity Reimagined
What if your creative process had its own metabolism? Imagine the ideas and skills in your design practice flowing in a cycle, getting refined and re-energized just like nutrients in a cell. In fact, one of the most intriguing metaphors for this is the Krebs Cycle of Creativity – a concept originally introduced by MIT’s Neri Oxman to map how Art, Science, Design, and Engineering feed into one another. Now, we’re playfully reimagining this cycle (see diagram below) as a tool for service and strategic designers to chart their professional skills, creative tendencies, and even unconscious biases. The result is an academically insightful yet fun framework – essentially a “creative metabolism” – that can help you reflect on where you thrive, where you might explore next, and how your creative energy regenerates over time.
Example:
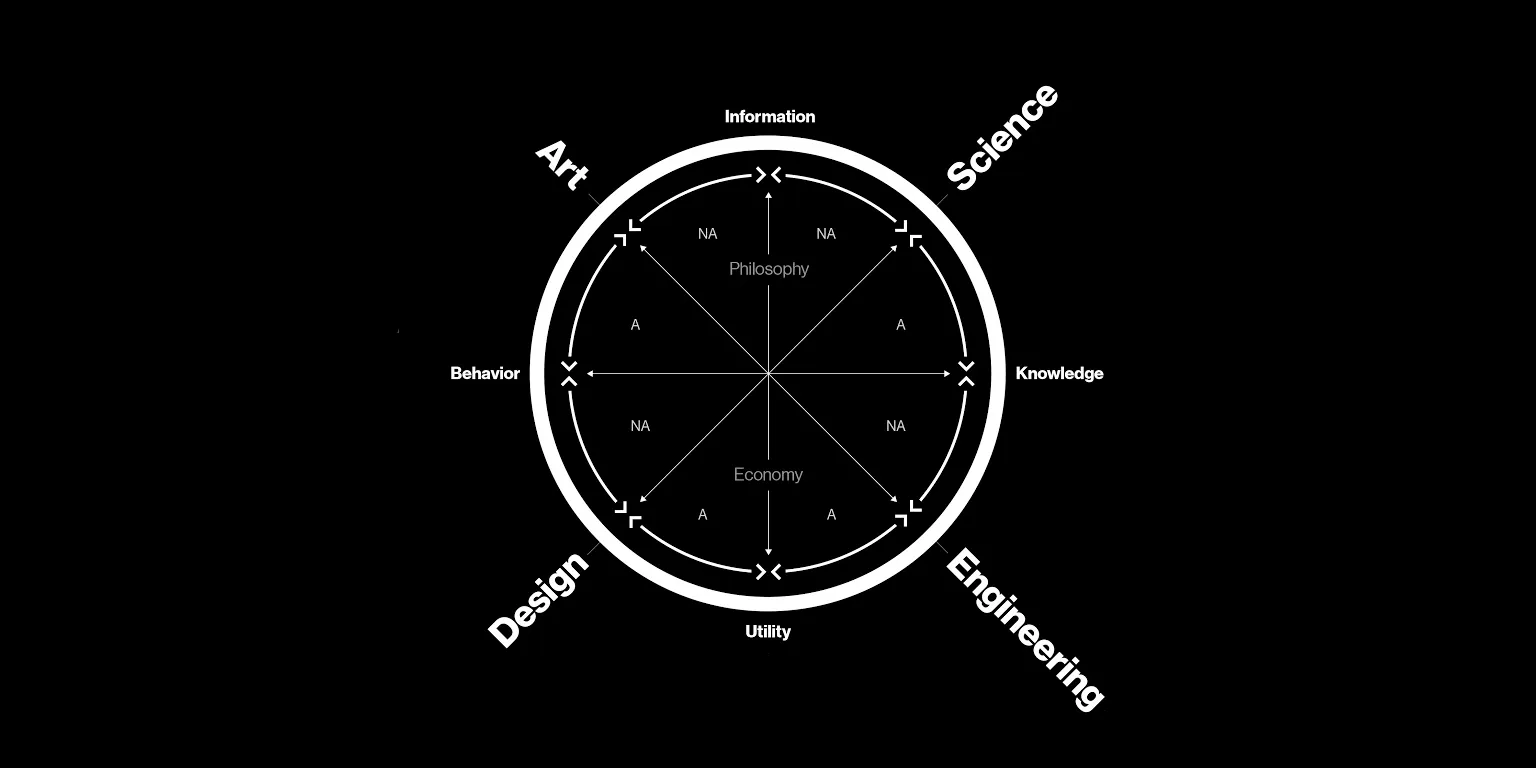
(Krebs Cycle Reimaged By Frida Moreno Cabrera)

The Creative Krebs Cycle as a Metaphor
The reimagined Krebs Cycle of Creativity diagram maps out creativity across overlapping domains. It draws on axes of Culture ↔ Nature (horizontal) and Philosophy ↔ Utility & Economy (vertical), with a dynamic flow between Perception-focused realms (upper half) and Production-focused realms (lower half). Each colored contour and labeled node represents a facet of creative work – from artistic storytelling to technical engineering – all part of one continuous “creative metabolism.”
At first glance, this concept borrows from biology: the classical Krebs cycle converts nutrients to energy in living cells. By analogy, the Krebs Cycle of Creativity shows how ideas generate creative energy (“creative ATP” or CreATP, as Oxman humorously calls it) by passing through different domains of knowledge and practice. In Oxman’s original model, Science, Engineering, Design, and Art replace the chemical compounds of the biochemical cycle. Each domain “produces” a form of creative currency by transforming into the next: Science turns information into knowledge; Engineering turns knowledge into utility; Design turns utility into cultural behavior; and Art takes that cultural context and questions our perception of the world. In other words, science feeds knowledge, engineering creates practical value from that, design translates value into human experience, and art challenges our worldview – completing the loop and sparking new questions for science. This cyclical map is meant to be fluid and holistic, not a rigid chart. As Oxman described, it’s a “holistic cartography” where one realm can incite evolution in another, and a single project (or person) might straddle multiple realms. Like a gyroscope or a compass, the cycle helps us navigate the creative landscape, encouraging movement across domains to generate fresh energy and insight.
Self-Mapping Your Skills and Tendencies
How can you use this cycle? Think of the diagram as a mirror for your own creative practice. It spans multiple dimensions – from culture vs. nature (human-centric insights ↔ scientific/technical insights), to philosophy vs. economy (idealistic theory ↔ practical value), and from perception to production (thinking and sensing ↔ hands-on making). Take a moment to locate your professional skills, favorite methods, and philosophies on this map. For example, do your strengths lie in culturally oriented, perceptive work (upper-left side), or in nature-driven, pragmatic work (bottom-right side)? By plotting what you do onto the cycle, you can start to see patterns in your approach:
Identify Your Go-To Domains: Mark the activities or skills you practice regularly (e.g. user research, prototyping, storytelling, data analysis). Notice which quadrant or region they cluster in. Are they mostly on the “Perception & Culture” side (conceptual, human-focused), on the “Production & Nature” side (tangible, tech-focused), or elsewhere?
Spot Underexplored Areas: Now note which domains or nodes you rarely engage with. Perhaps you excel in strategic brainstorming but haven’t dabbled in ethnography, or you’re fluent in UX prototyping but shy away from philosophical art critiques. These gaps might indicate underexplored fuel for your creative metabolism – new perspectives that could invigorate your practice.
Reflect on Biases: Our unconscious biases often manifest as habitual comfort zones. Do you instinctively favor data and Science over intuition, or vice versa? Lean heavily on Production (getting things done) while neglecting Perception (observing and questioning)? Recognizing these tendencies on the cycle can be enlightening. You might realize, for instance, that you’ve been framing every problem through a human-centered design lens (strong in the Culture/Design quadrant) while overlooking insights from the Nature/Science side like environmental context or systems thinking – or maybe the opposite. This awareness is the first step to broadening your creative repertoire.
Nodes of Creativity – from Storytelling to UX
The Krebs Cycle of Creativity Reimagined diagram is populated with specific nodes – think of them as landmarks on the map where particular skills or practices live. Highlighting a few examples can illustrate how diverse the creative landscape is:
Storytelling: This node appears in the Perception & Culture realm (upper left area, often aligned with the Art domain). Storytelling in design is about crafting narratives and shaping perception. If you’re a brand strategist or service designer who weaves compelling stories, you’re tapping into this cultural-perceptual energy. Storytelling helps translate complex information into human context, and on our cycle it reminds us how narrative influences what people perceive and believe – a spark that can lead back into scientific inquiry or design action.
Affective Design: Placed nearer the center of the cycle (around the Design quadrant), affective design focuses on creating emotional experiences. It’s a blend of perception and production: you might be building a product or service (production) with the deliberate aim to evoke feelings and empathy (perception). Operating in this zone means you’re considering not just how something works, but how it makes people feel. It’s a great example of cross-pollination on the cycle – bridging human emotions (Culture) with designed outcomes (Production).
Co-Design: This node signifies collaborative design practices, where designers and stakeholders (users, community, clients) create solutions together. Co-design shows up on the map linking the knowledge-intensive side with the cultural side – essentially marrying Science/Knowledge and Design/Behavior domains. If you engage in co-design, you’re deliberately cycling between gathering insight (even letting non-designers impart knowledge) and making decisions or prototypes collectively. It reveals an ideological tendency toward inclusivity and humility in your process. Seeing Co-Design on your map might indicate you value shared creativity and are comfortable letting your role blur between expert and facilitator.
UX (User Experience): UX appears in the Production & Culture quadrant – the heart of design practice – alongside things like service design and product design. If you’re a UX designer, you’re focused on shaping how people interact with products or systems, which means translating human behavior and needs into concrete design solutions. On the cycle, UX sits closer to the “making” side but always informed by the “human” side. It exemplifies how practical design work (wireframes, interfaces, prototypes) loops back to influence behavior and culture. A strong presence of UX on your personal map might mean you excel at bridging user perception and design production, though you might consider whether you also incorporate, say, scientific research (to gather evidence) or artistic exploration (to inspire innovative interaction ideas) from other parts of the cycle.
Notice how each of these example nodes occupies a distinct niche, yet none exist in isolation. Storytelling might feed into UX (a great story can shape a user journey), Affective Design principles can be informed by psychology research (Science domain), Co-Design might yield insights that inform engineering constraints, and so on. The power of the Krebs Cycle metaphor is in showing these connections: every skill is part of a greater system. By mapping a few nodes that are familiar to you, you start to see the bigger picture of your creative practice – how the areas you work in connect, and what lies adjacent that you haven’t tried yet.
Flow and Renewal in Your Creative Practice
One of the most exciting aspects of this framework is its emphasis on flow. Creativity isn’t static; it’s more like a circulation that can loop through different phases. Think of a project you’ve worked on: you might begin by absorbing contextual research (perception, like trends, user feelings, cultural cues), then move into ideation and making prototypes (production), then refine those through testing and feedback (blending science-like analysis with design), and finally deliver an outcome that influences people or culture. The next project, or the next iteration, starts anew – informed by that changed culture or by new knowledge gained. In this way, your work cycles and regenerates creative energy over time, much as the Krebs cycle regenerates its chemical fuel.
Viewing your career or a single project through this cyclical lens can be surprising and enlightening. It encourages you to ask: Where am I in the cycle right now? Are you dwelling too long in one stage (analysis paralysis in the Science quadrant, or endless tweaking in the Design quadrant)? Would a leap to another domain spark fresh energy (maybe an artistic experiment to shift perspective, or an engineering exercise to test feasibility)? The creative metabolism thrives on movement. Stagnation in one corner can lead to creative fatigue, but circulating to a different domain can renew your “creative ATP” and momentum.
Try It Yourself: An Invitation to Reflect
This reimagined Krebs Cycle of Creativity isn’t just a neat diagram – it’s a tool meant to be used. The invitation here is to chart your own creative cycle. Revisit the diagram (above) and mark it up for yourself: What nodes or domains do you light up, and which remain dim? You might discover, for instance, that your strengths cluster in Strategic Design and UX (lower left), with only a thin line connecting to any Scientific research (upper right) – an insight that you could benefit from more data-driven exploration. Or perhaps you’re strong in Artistic ideation and Storytelling, but realize you haven’t ventured much into Engineering or Systems Design – suggesting an opportunity to prototype more or learn a new technical skill. There is no “correct” balance, but expanding into underused areas of the cycle can enrich your practice and lead to more innovative outcomes.
Give it a spin (literally, if you imagine the cycle spinning): print it out or sketch your own, and plot your current project or your career path on it. Which domain do you start in? Where do you end up? How could you loop back or branch out differently next time? Treat it as a creative exercise – one that might reveal hidden patterns in how you work and inspire you to venture into new territory. By regularly reflecting with the Krebs Cycle of Creativity, you’ll cultivate a more self-aware, adaptive, and holistic design practice. Just as the biological Krebs cycle is essential for life’s energy, this creative Krebs cycle could become essential for keeping your professional creativity alive, kicking, and ever-regenerating.
Now, take a look at the diagram again and consider: Where will you go in your next creative cycle, and what new energy will you unleash?
Sources: Neri Oxman’s Krebs Cycle of Creativity framework; diagram adapted and reimagined for design practice (courtesy of the user’s upload).
date published
Jan 12, 2025
reading time
Reimagined Krebs Cycle of Creativity for design professionals